I designed and implemented a C# computer language application to model the global greenhouse gas concentrations data found on the NOAA website:
https://www.esrl.noaa.gov/gmd/aggi/aggi.html
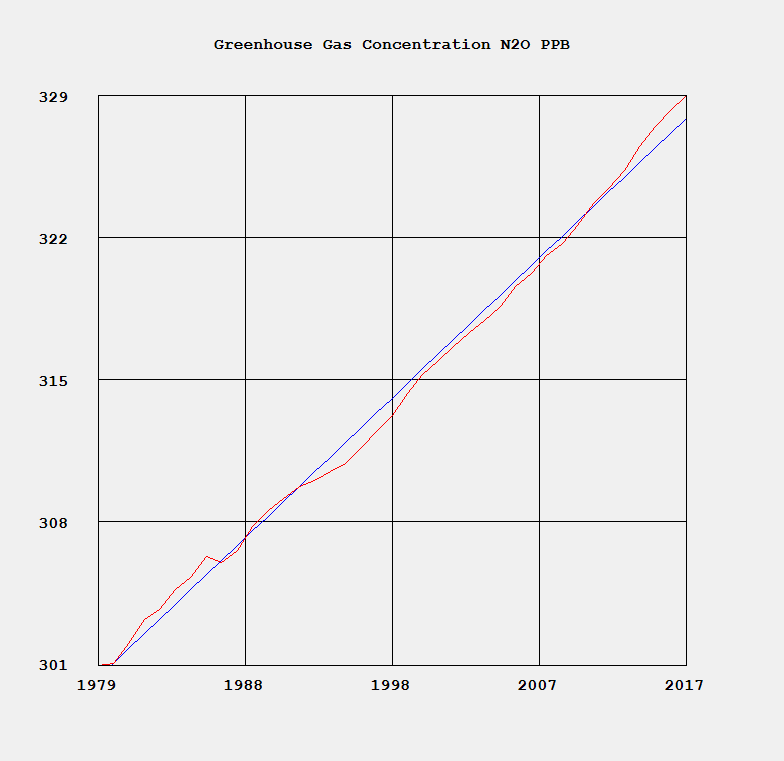
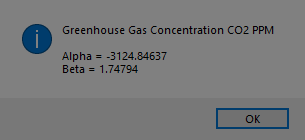
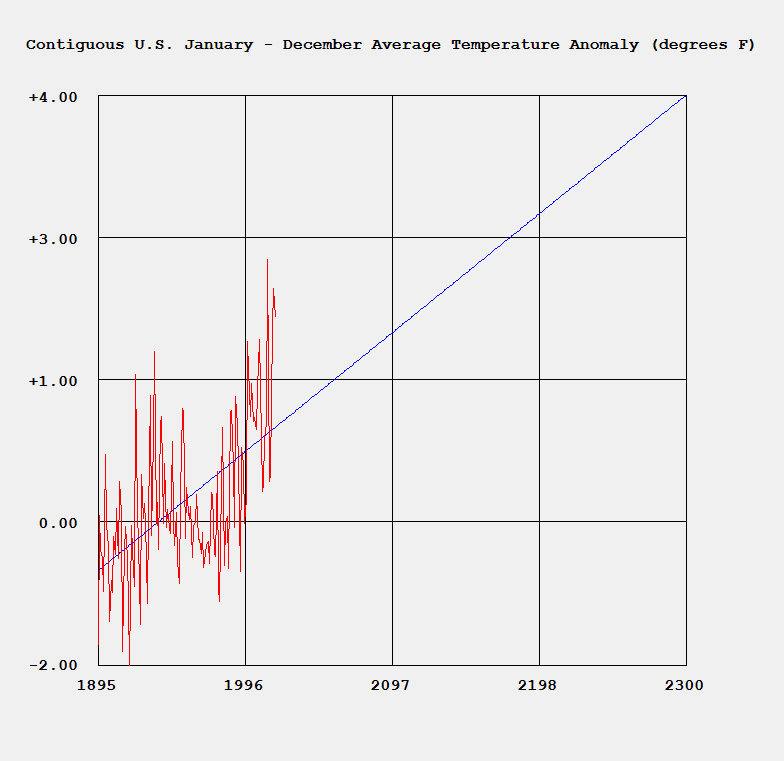
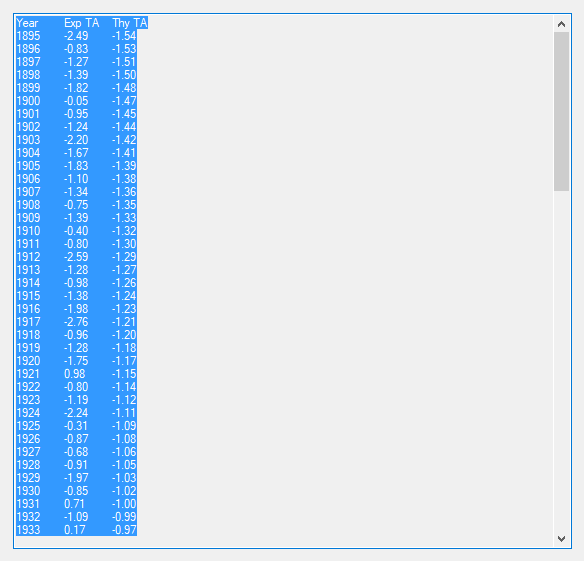
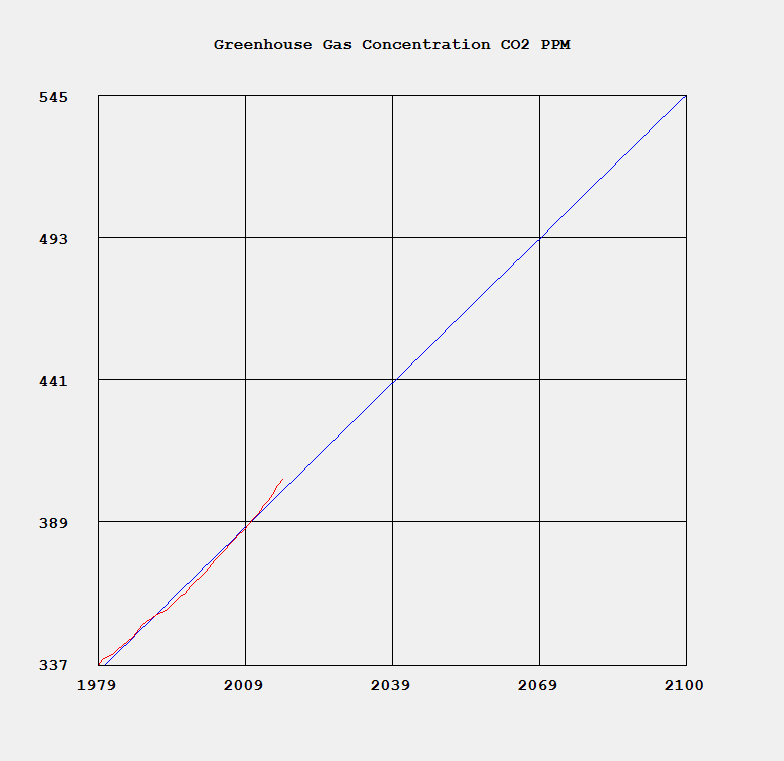
I used the latest recommended data for time period 1979 to 2017. The concentrations of three greenhouse gases were modeled: carbon dioxide (CO2), methane (CH4), and nitrous oxide (N2O).
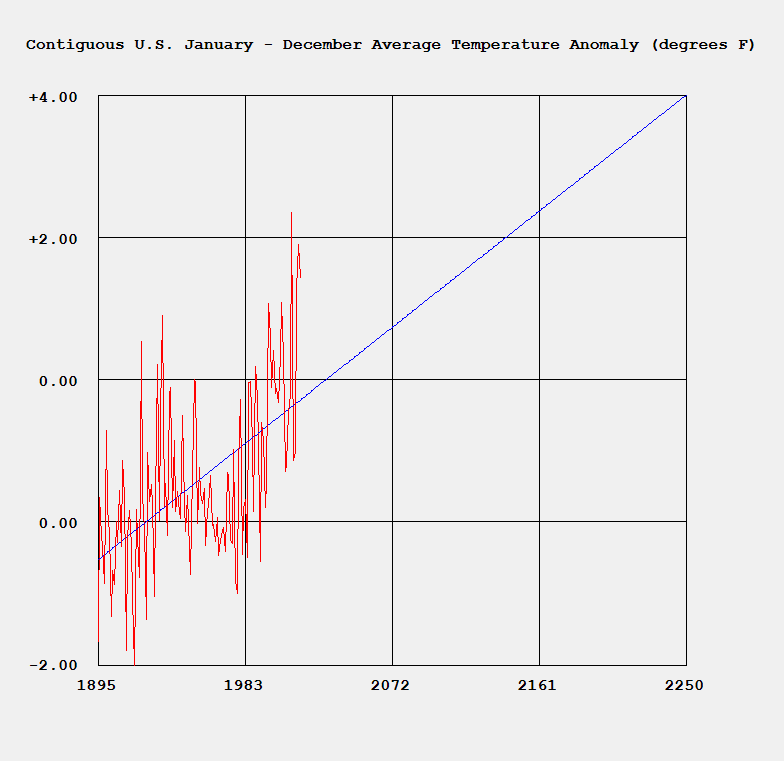
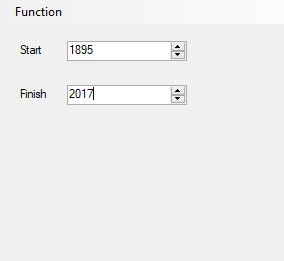
The empirical modeling paradigm I used was simple linear regression. My model goes out to the year 2300. The key formulas used by the model are:

See the website:
https://en.wikipedia.org/wiki/Simple_linear_regression
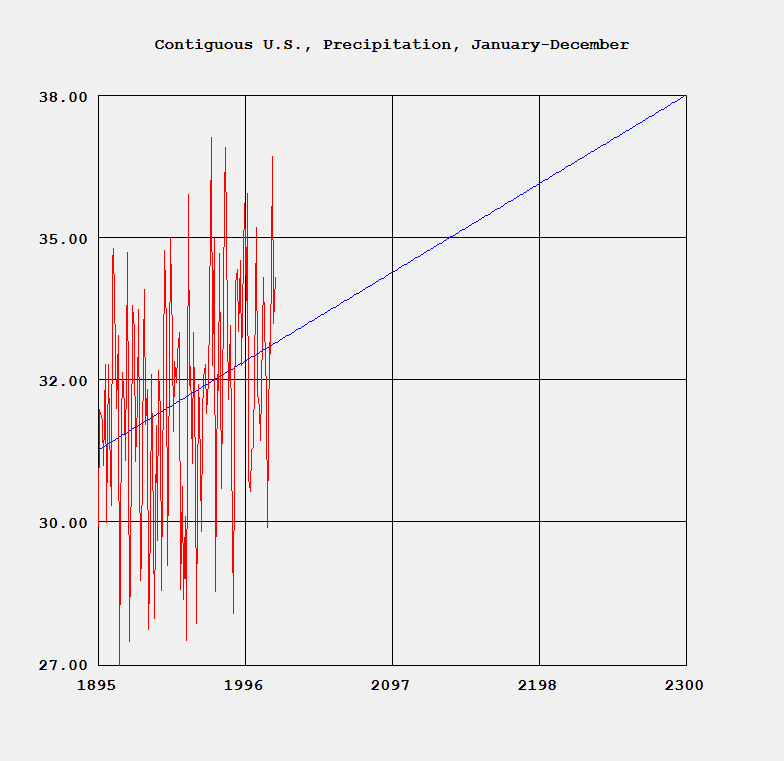
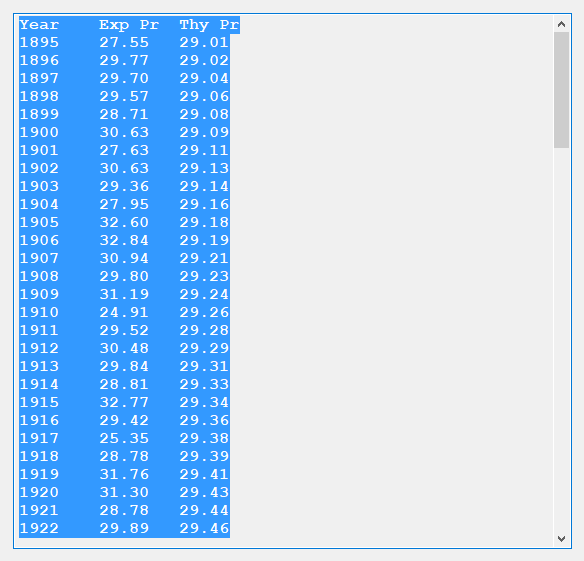
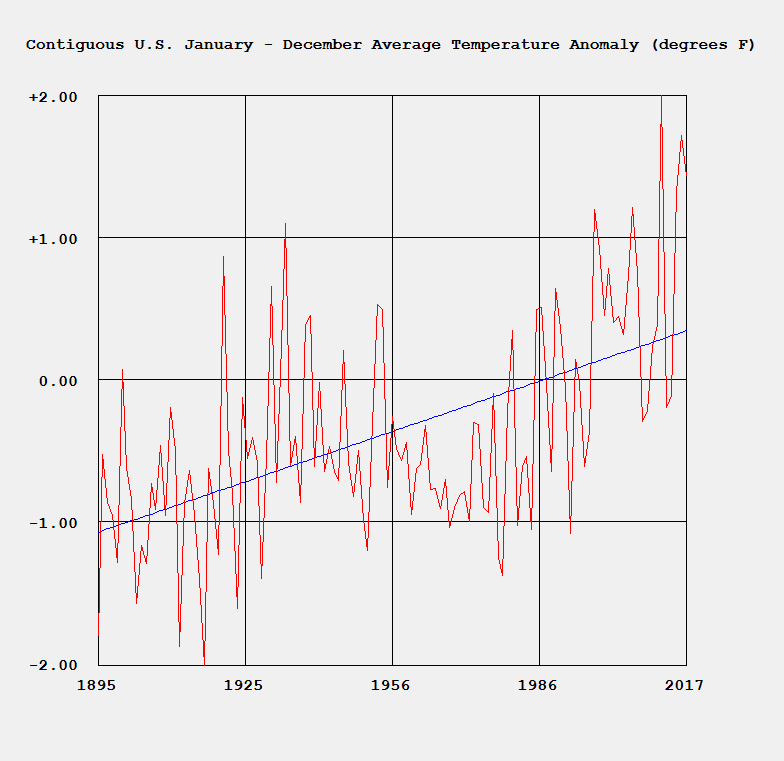
Some plots of the concentrations in parts per million (PPM) and parts per billion (PPB) are given below.