NOAA Contiguous United States of America Temperature Anomaly by James Pate Williams Jr BA, BS, MSwE, PhD

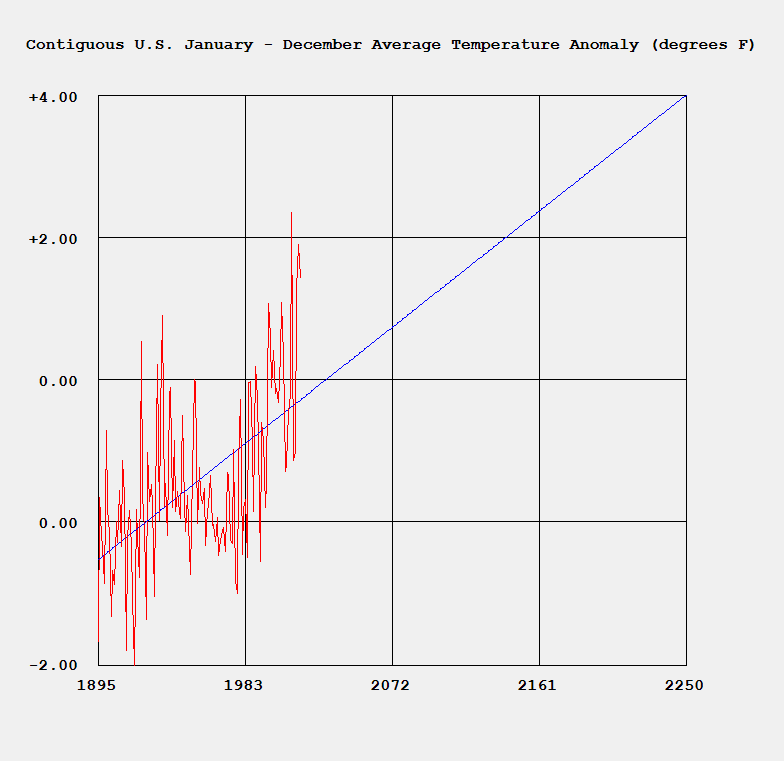
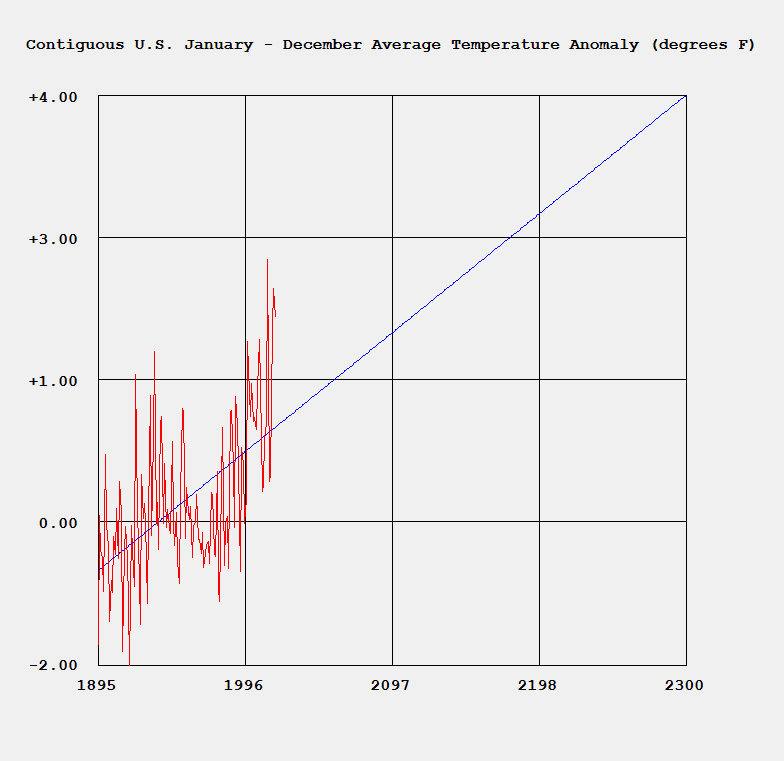
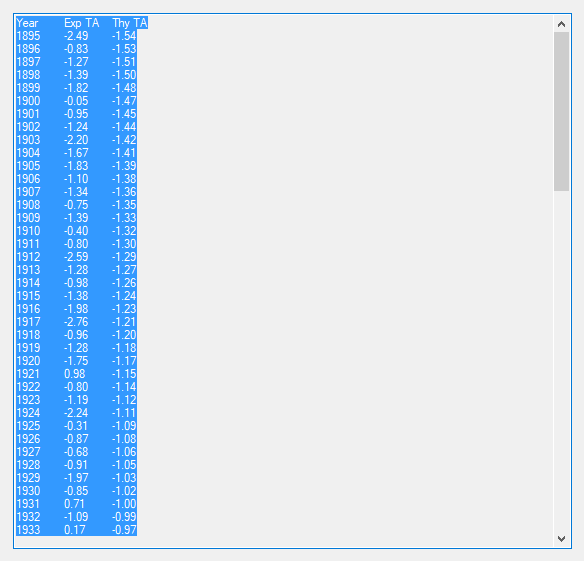
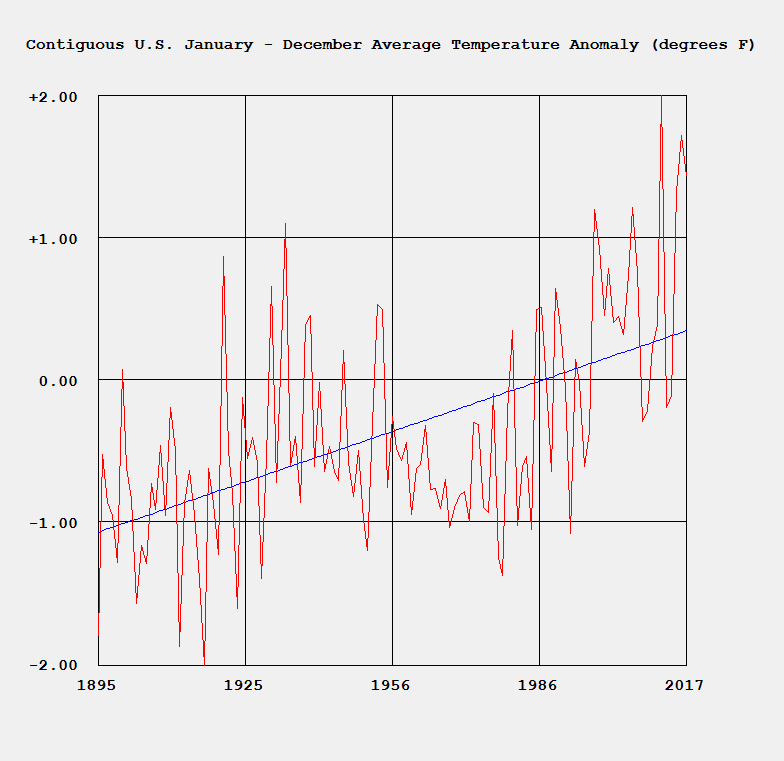
I designed and implemented a C# computer language application to model the temperature anomaly data found on the NOAA website:

https://www.ncdc.noaa.gov

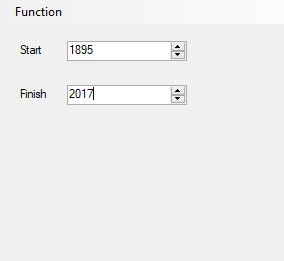
I used the latest recommended data for time period 1895 to 2017. The empirical modeling paradigm I used was simple linear regression. My model goes out to the year 2300. The key formulas used by the model are:

Simple Linear Regression Equations

See the website:

https://en.wikipedia.org/wiki/Simple_linear_regression

Below are some plots of the temperature anomaly.

Temperature Anomaly Actual Anomaly in Red Theoretical in Blue
C# Application Main Form
Simple Linear Regression Parameters
Table Function Form with Experimental and Theoretical Anomalies